5.2 - Restoration Planning
Extracting data from QGIS - Using the GroupStats Plugin
Plug-ins are additonal pieces of functionality that can be added to QGIS using the Plug-in manager. However, for the purposes of this course we have already installed GroupStats for you. GroupStats can be used to summarise your data quickly as well as carry out calculations, similar to Excel.
GroupStats can be opened by navigating to Vector > Group Stats or by clicking the GroupStats icon
 .
.Below is an example dataset produced by GroupStats which shows all the grips, gullies, and hags for a site, displayed with their categories.
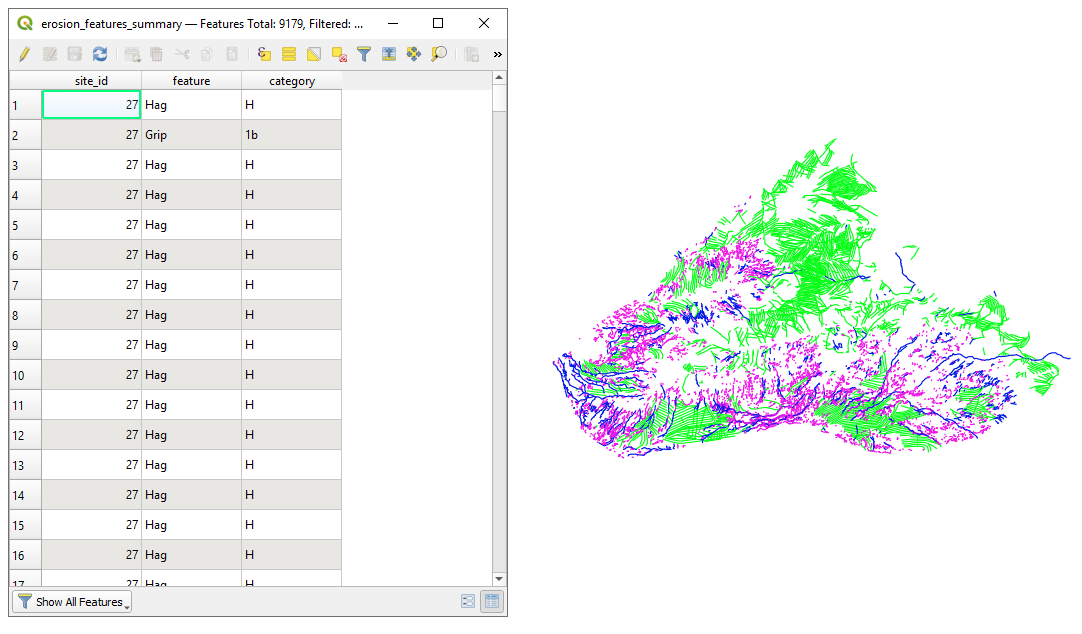
The plugin works by dragging and dropping the desired fields into the Column, Row and Value boxes on the GroupStats window.
The large box on the left-hand side will display the results of your calculation.
If you are familiar with Excel Pivot Tables, the principle is the same.
How to create a GroupStats calculation
First, select the layer you are would like to analyse on the Layers drop down which will populate the Fields box.
The Rows or Column box is where you put the field you want to group by.
The Value box takes two parameters - the value you want to aggregate, and the aggregation function.
In this example, the value to be aggregated is from the erosion_features_summary layer (which takes values of all grips, gullies and hags).
The value to be produced is Length, using the aggregation function Sum.
In the results you can see rows for the total length of grips, gullies and hags on the map.
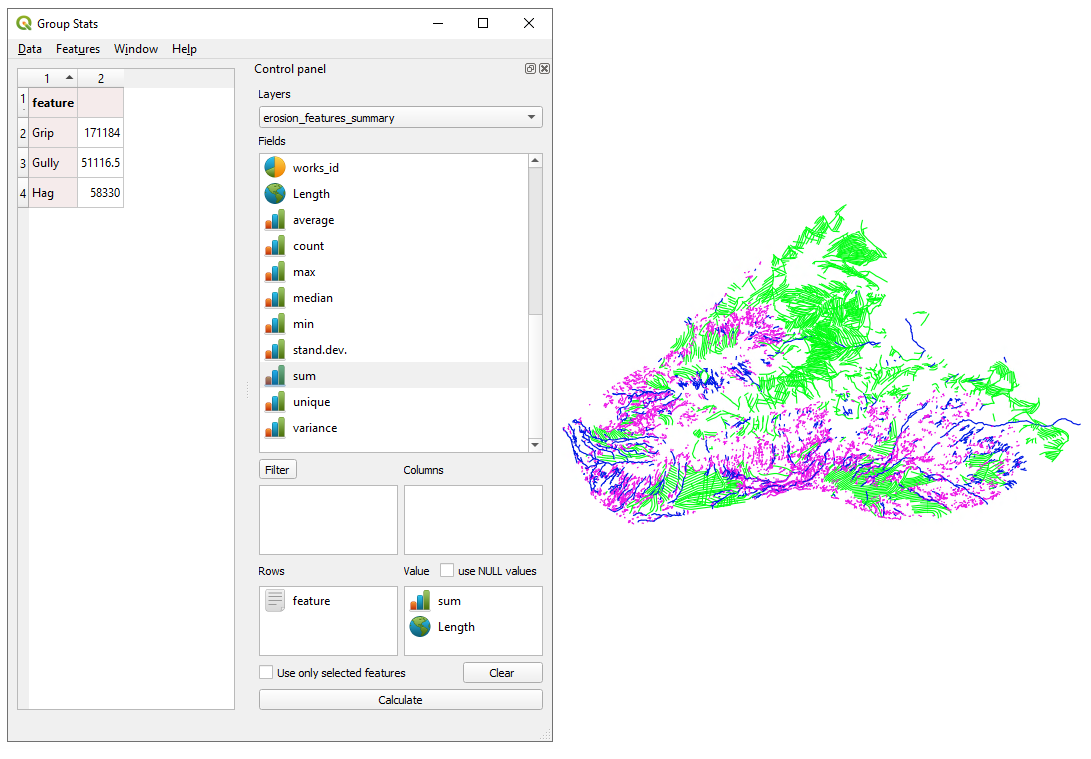
The values displayed will be measured in the units used by the QGIS project, in our case it is measured in metres.
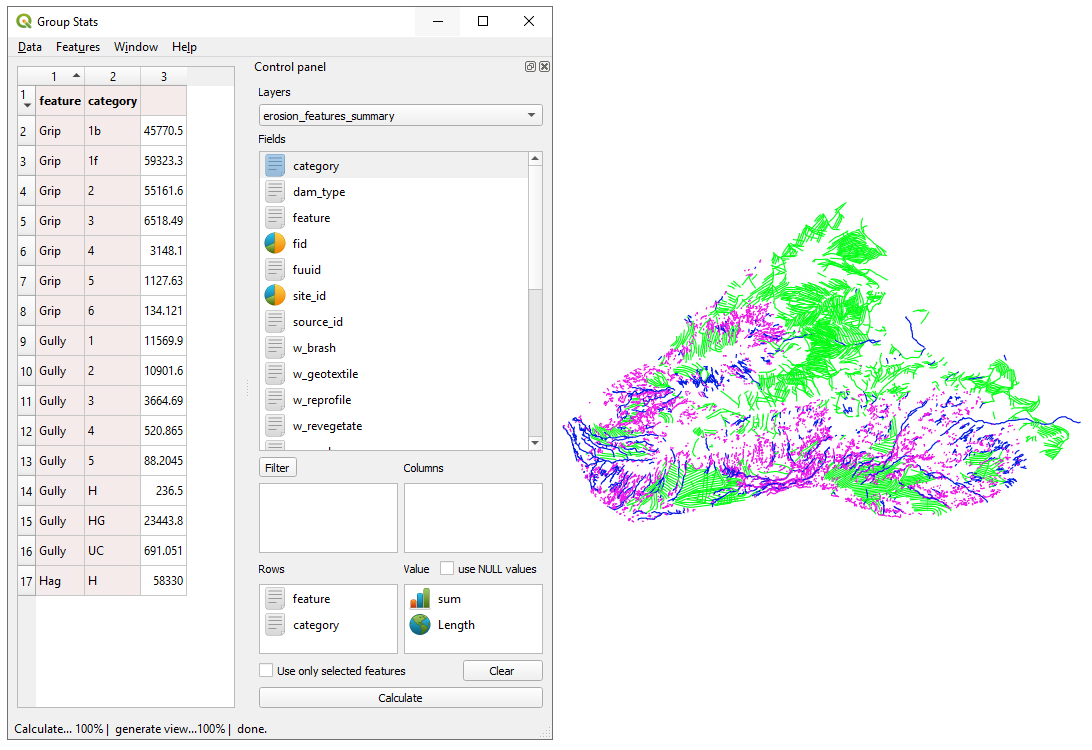
Using multiple data fields
You can group the data by multiple fields, in the Rows or Columns boxes
Once you have setup the inputs to the GroupStats calculation, click Calculate to see the result:
GroupStats Example
In this animated example we show the creation of a sum of all Grip lengths, a sum of Bare Peat area and then a sum of Bare Peat separated by category.